Muchas veces debemos realizar la implementación de una librería de gráficas para nuestro proyecto en Angular 2+, pero no siempre las documentaciones oficiales nos solventan todas nuestras necesidades, hoy vamos aprender como implementar una de las mejores librerías de la actualidad con los 4 tipos de gráficas más comunes (Pie, Bar, Funnel, Line)
Adicional a eso, les enseñare como usar algunas propiedades de los tipos de gráfica para que puedan: invertir los ejes, cambiar el tamaño de los valores o legendas, mostrar tooltips, customizar textos que se muestra, mostrar totalizadores, etc.
Lo primero que debemos hacer es ejecutar los comandos para instalar nuestra librería
npm install @amcharts/amcharts4 –-savey para navegadores más antiguos como Internet Explorer usamos el siguiente comando
npm install core-js @types/core-js –-saveUna vez instalado, nos dirigimos a nuestro archivo app.modules.ts y agregamos lo siguiente:
import * as am4core from "@amcharts/amcharts4/core";
import am4themes_animated from "@amcharts/amcharts4/themes/animated";
a continuación agregamos nuestra configuración:
export class AppModule {
  constructor () {
am4core.useTheme(am4themes_animated);
  }
}
Implementación de Pie Chart
En nuestro HTML agregamos nuestro div para referenciar nuestra gráfica:
<div id="pieChart" style="width: 100%; height: 500px"></div>En nuestro controlador importamos las siguientes líneas:
import * as am4core from "@amcharts/amcharts4/core";
import * as am4charts from "@amcharts/amcharts4/charts";
Inicializamos la variable para la gráfica de Pie
let pieChart = am4core.create(‘pieChart’, am4charts.PieChart);
let pieChart = am4core.create('pieChart', am4charts.PieChart);Propiedades para customizar el título de la gráfica:
let title = pieChart.titles.create();
title.text = "Título de" + "\n" + " la grafica"
title.fontSize = 23;
title.textAlign = "middle";
title.marginTop = 25;
title.marginBottom = 25;
Definimos el los datos de la gráfica:
pieChart.data = [{
  "name": "Lithuania",
  "value": 501.9
}, {
  "name": "Germany",
  "value": 165.8
}]
Opción para que la grafica ser responsive y define las series con su respectiva referencia:
pieChart.responsive.enabled = true;
pieChart.seriesContainer.createChild(am4core.Label);
let pieSeries = pieChart.series.push(new am4charts.PieSeries());
pieSeries.dataFields.value = "value";
pieSeries.dataFields.category = "name";
Definir el texto que se van a mostrar en los tooltips:
pieSeries.slices.template.tooltipText = "{category}: {value.percent.formatNumber('#.0')}%";Definimos los colores que tendrán nuestras series:
pieSeries.colors.list = [
  am4core.color('#525252'),
  am4core.color('#064acb')
]
Opción para mostrar los valores dentro del Pie:
pieSeries.ticks.template.disabled = true;
pieSeries.alignLabels = false;
pieSeries.labels.template.radius = am4core.percent(-30);
pieSeries.labels.template.fill = am4core.color("white");
Opción para customizar el texto que vamos a mostrar dentro o fuera del Pie:
pieSeries.labels.template.text = "{value.value}";Opción para la exportación del archivo de la gráfica:
pieChart.exporting.menu = new am4core.ExportMenu()
pieChart.exporting.menu.align = "left";
pieChart.exporting.menu.verticalAlign = "top";
Opción para definir el nombre que tendrá nuestro archivo exportado, los tipos de archivos a exportar:
pieChart.exporting.filePrefix = "grafica de pie"
pieChart.exporting.useWebFonts = false
pieChart.tooltip.exportable = false;
pieChart.exporting.menu.items = [{
  label: "...",
  menu: [
{ type: "png", label: "PNG" },
{ type: "jpg", label: "JPG" },
{ type: "pdf", label: "PDF" }
  ]
}];
Opción para definir si se quiere mostrar leyendas y customizar que texto y valor se van a mostrar:
pieChart.legend = new am4charts.Legend();
pieChart.legend.labels.template.text = "{category}"
pieChart.legend.valueLabels.template.text = "{value.value}";
pieChart.legend.fontSize = "10px"
Nota: Muchas de las configuraciones ya mostradas se implementan de forma similar para los otros tipos de gráficas por esta razón solo vamos a explicar las opciones de configuracion restantes, a continuación veremos los otros ejemplos
Ejemplo:

Implementación de Bar Chart
En nuestro HTML agregamos nuestro div para referenciar nuestra gráfica:
<div id="barChart" style="width: 100%; height: 500px"></div>En nuestro controlador importamos las siguientes líneas:
import * as am4core from "@amcharts/amcharts4/core";
import * as am4charts from "@amcharts/amcharts4/charts";
Inicializamos la variable para la gráfica de Barras:
let barChart = am4core.create('barChart', am4charts.XYChart);

let title = barChart.titles.create();
title.text = "Título de la gráfica"
title.fontSize = 23;
title.textAlign = "middle";
title.marginTop = 25;
title.marginBottom = 25;

barChart.colors.list = [
  am4core.color('#525252'),
  am4core.color('#064acb'),
  …
]

barChart.hiddenState.properties.opacity = 0;

barChart.data = [{
  	category: "One",
  	value1: 1,
  	value2: 5,
  	value3: 3,
  	total: 0
	},
	{
  	category: "Two",
  	value1: 2,
      value2: 5,
  	value3: 3,
  	total: 0
	},
	{
  	category: "Three",
  	value1: 3,
  	value2: 5,
  	value3: 4,
  	total: 0
	}]

barChart.responsive.enabled = true;

barChart.colors.step = 2;
barChart.padding(30, 30, 10, 30);

barChart.legend = new am4charts.Legend();
barChart.legend.fontSize = "10px"
barChart.legend.position = "bottom"

let categoryAxis = null
Opción para invertir los ejes de la grafica, por defecto la dejaremos normal:
Nota: Las opciones pueden variar dependiendo si desea que la gráfica se pueda invertir o se deje normal
//categoryAxis = barChart.yAxes.push(new am4charts.CategoryAxis());
categoryAxis = barChart.xAxes.push(new am4charts.CategoryAxis());
categoryAxis.renderer.minGridDistance = 10;
categoryAxis.renderer.labels.template.rotation = 310;

categoryAxis.dataFields.category = "category";
categoryAxis.renderer.grid.template.location = 0;
categoryAxis.fontSize = 10

let valueAxis = null
La opción depende si la grafica esta invertida o no:
// valueAxis = barChart.xAxes.push(new am4charts.ValueAxis());
valueAxis = barChart.yAxes.push(new am4charts.ValueAxis());
valueAxis.min = 0;
valueAxis.strictMinMax = false;
valueAxis.calculateTotals = true;
valueAxis.renderer.minWidth = 50;


let series1 = barChart.series.push(new am4charts.ColumnSeries());
La opción depende si la gráfica está invertida o no:
// series1.dataFields.valueX = “value1”;
// series1.dataFields.categoryY = "category";

series1.dataFields.categoryX = "category";
series1.dataFields.valueY = “value1”;

series1.stacked = true;
series1.name = “Value 1”;
La opción depende si la gráfica está invertida o no:
// series1.columns.template.tooltipText = "{name}: {valueX}"
series1.columns.template.tooltipText = "{name}: {valueY}";
Opción para mostrar los valores dentro de las gráficas, si no desea mostrar valor omite el siguiente código:
let bullet1 = series1.bullets.push(new am4charts.LabelBullet());/ La opción depende si la gráfica está invertida o no:
// bullet1.label.text =  "{valueX}"
bullet1.label.text = "{valueY}";
bullet1.label.fill = am4core.color("#fff");
La opción depende si la gráfica está invertida o no:
// bullet1.locationX = 0.5;
bullet1.locationY = 0.5;
Nota: Se repiten las mismas opciones para las demás series
let series2 = barChart.series.push(new am4charts.ColumnSeries());

// series2.dataFields.valueX = “value2”;
// series2.dataFields.categoryY = "category";
series2.dataFields.categoryX = "category";
series2.dataFields.valueY = “value2”;

series2.stacked = true;
series2.name = “Value 2”
// series2.columns.template.tooltipText = "{name}: {valueX}"
series2.columns.template.tooltipText = "{name}: {valueY}";

let bullet2 = series2.bullets.push(new am4charts.LabelBullet());

// bullet2.label.text =  "{valueX}"
bullet2.label.text = "{valueY}";

bullet2.label.fill = am4core.color("#fff");

// bullet2.locationX = 0.5;
bullet2.locationY = 0.5;


let series3 = barChart.series.push(new am4charts.ColumnSeries());

// series3.dataFields.valueX = “value3”;
// series3.dataFields.categoryY = "category";

series3.dataFields.categoryX = "category";
series3.dataFields.valueY = “value3”;

series3.stacked = true;
series3.name = “Value 3”;

// series3.columns.template.tooltipText = "{name}: {valueX}"
series3.columns.template.tooltipText = "{name}: {valueY}";

let bullet3 = series3.bullets.push(new am4charts.LabelBullet());

// bullet3.label.text =  "{valueX}"
bullet3.label.text = "{valueY}";

bullet3.label.fill = am4core.color("#fff");

// bullet3.locationX = 0.5;
bullet3.locationY = 0.5;
Opción para mostrar el total en la parte superior de cada barra, en caso de no querer mostrarlo, omitir el siguiente código:
Nota: para que esto funcione de la mejor manera es necesario que en cada objeto exista una propiedad total con valor en 0
let seriesTotal = barChart.series.push(new am4charts.ColumnSeries());La opción depende si la gráfica está invertida o no:
// seriesTotal.dataFields.valueX = "total"
// seriesTotal.dataFields.categoryY = "category"

seriesTotal.dataFields.categoryX = "category"
seriesTotal.dataFields.valueY = "total"

seriesTotal.stacked = true
seriesTotal.hiddenInLegend = true
seriesTotal.columns.template.strokeOpacity = 0
La opción depende si la gráfica está invertida o no:
// let totalBullet = seriesTotal.bullets.push(new am4charts.LabelBullet())
// totalBullet.label.dx = 10;
// totalBullet.label.text = "{valueX.total}"
// totalBullet.label.horizontalCenter = "left";
// totalBullet.label.truncate = false;
// totalBullet.label.hideOversized = false;
// totalBullet.label.fontSize = 12
// totalBullet.label.background.fill = seriesTotal.stroke
// totalBullet.label.background.fillOpacity = 0.2
// totalBullet.label.padding(5, 10, 5, 10)

var totalBullet = seriesTotal.bullets.push(new am4charts.LabelBullet())
totalBullet.dy = -20
totalBullet.label.text = "{valueY.total}"
totalBullet.label.hideOversized = false
totalBullet.label.fontSize = 12
totalBullet.label.background.fill = seriesTotal.stroke
totalBullet.label.background.fillOpacity = 0.2
totalBullet.label.padding(5, 10, 5, 10)


barChart.exporting.menu = new am4core.ExportMenu();
barChart.exporting.menu.align = "left";
barChart.exporting.menu.verticalAlign = "top";

barChart.exporting.filePrefix = "name export file"

barChart.exporting.useWebFonts = false
barChart.tooltip.exportable = false;
barChart.exporting.menu.items = [{
  label: "...",
  menu: [
{ type: "png", label: "PNG" },
{ type: "jpg", label: "JPG" },
{ type: "pdf", label: "PDF" }
  ]
}];
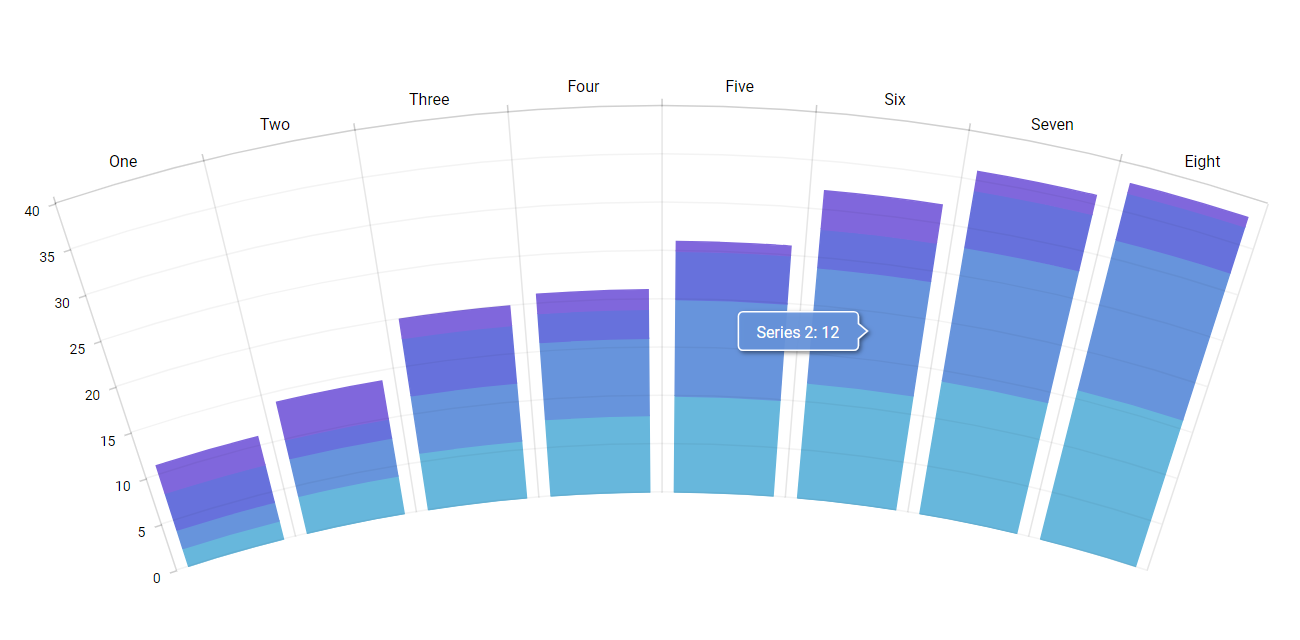
Ejemplo:

Implementación de Funnel Chart
<div id="funnelChart" style="width: 100%; height: 500px"></div>

import * as am4core from "@amcharts/amcharts4/core";
import * as am4charts from "@amcharts/amcharts4/charts";

let funnelChart = am4core.create('funnelChart', am4charts.SlicedChar);

title.text = "Título de la gráfica"
title.fontSize = 23;
title.textAlign = "middle";
title.marginTop = 25;
title.marginBottom = 25;

funnelChart.data = [{
	"name": "Stage #1",
	"value": 600
  }, {
	"name": "Stage #2",
	"value": 300
  }, {
	"name": "Stage #3",
	"value": 200
  }, {
    "name": "Stage #4",
	"value": 180
  }
]


funnelChart.responsive.enabled = true;

let series = funnelChart.series.push(new am4charts.FunnelSeries());
series.dataFields.value = "value";
series.dataFields.category = "name";

// series.slices.template.tooltipText = "{category}: {value.value}"
series.slices.template.tooltipText = "";
series.fontSize = 10

series.colors.list = [
  am4core.color('#525252'),
  am4core.color('#064acb'),
  …
]
Opción para mostrar los números dentro de la gráfica
// series.labels.template.fill = am4core.color('#ffffff')
// series.labels.template.text = "[bold]{value}[/]";
series.alignLabels = true;
series.labels.template.text = "{category}: [bold]{value}[/]";


funnelChart.exporting.menu = new am4core.ExportMenu();
funnelChart.exporting.menu.align = "left";
funnelChart.exporting.menu.verticalAlign = "top";

funnelChart.exporting.filePrefix = "name export file"

funnelChart.exporting.useWebFonts = false
series.tooltip.exportable = false;
funnelChart.exporting.menu.items = [{
  label: "...",
  menu: [
{ type: "png", label: "PNG" },
{ type: "jpg", label: "JPG" },
{ type: "pdf", label: "PDF" }
  ]
}];

funnelChart.legend = new am4charts.Legend();
funnelChart.legend.labels.template.text = "{category}"
funnelChart.legend.valueLabels.template.text = ""
funnelChart.legend.fontSize = "10px"
Ejemplo:
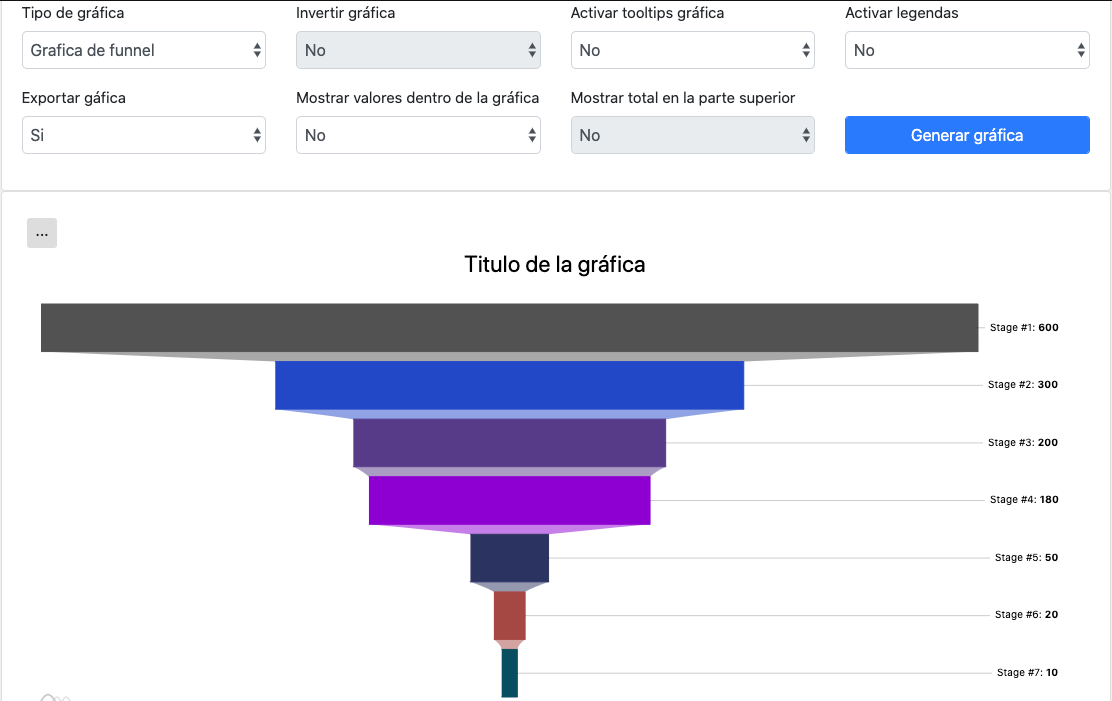
Implementación de Line Chart
<div id="lineChart" style="width: 100%; height: 500px"></div>

import * as am4core from "@amcharts/amcharts4/core";
import * as am4charts from "@amcharts/amcharts4/charts";

let lineChart = am4core.create('lineChart', am4charts.XYChart);

title.text = "Título de la gráfica"
title.fontSize = 23;
title.textAlign = "middle";
title.marginTop = 25;
title.marginBottom = 25;

lineChart.colors.list = [
  am4core.color('#525252'),
  am4core.color('#064acb'),
  …
]

lineChart.data = this.lineChartService.getData
lineChart.responsive.enabled = true;

let categoryAxis = lineChart.xAxes.push(new am4charts.CategoryAxis());
categoryAxis.dataFields.category = "date";
categoryAxis.renderer.opposite = false;
categoryAxis.renderer.minGridDistance = 10;
categoryAxis.renderer.labels.template.rotation = 310;
categoryAxis.fontSize = 10

// categoryAxis.cursorTooltipEnabled = true;
categoryAxis.cursorTooltipEnabled = false;

let valueAxis = lineChart.yAxes.push(new am4charts.ValueAxis());
valueAxis.renderer.inversed = false;
valueAxis.renderer.minLabelPosition = 0.1;

// valueAxis.cursorTooltipEnabled = true;
valueAxis.cursorTooltipEnabled = false;

let series = chart.series.push(new am4charts.LineSeries());
series.dataFields.valueY = field;
series.dataFields.categoryX = "date";
series.name = text;
series.strokeWidth = 2;
series.bullets.push(new am4charts.CircleBullet());
series.legendSettings.valueText = "{valueY}";
series.visible = false;


// series.tooltipText = "{name} : {valueY}";

//Show numbers at the top
let bullet1 = series.bullets.push(new am4charts.LabelBullet());
bullet1.label.text = "{valueY}";
bullet1.label.verticalCenter = "bottom";
bullet1.label.padding(5, 10, 5, 10);

lineChart.exporting.menu = new am4core.ExportMenu();
lineChart.exporting.menu.align = "left";
lineChart.exporting.menu.verticalAlign = "top";

lineChart.exporting.filePrefix = "name export file"

lineChart.exporting.useWebFonts = false
lineChart.tooltip.exportable = false;
lineChart.exporting.menu.items = [{
  label: "...",
  menu: [
{ type: "png", label: "PNG" },
{ type: "jpg", label: "JPG" },
{ type: "pdf", label: "PDF" }
  ]
}];

lineChart.cursor = new am4charts.XYCursor();
lineChart.cursor.behavior = "zoomX";

lineChart.legend = new am4charts.Legend();
lineChart.legend.fontSize = "10px"
Ejemplo:

Ahora podemos usar nuestras gráficas de una manera más personalizada y de una manera fácil, así podremos crear gráficas más dinámicas cuando lo necesitemos.
Espero este post les haya servido y haya aclarado alguna de sus dudas, si tienen alguna pregunta o sugerencia por favor comenten y estaré respondiendo lo antes posible. A continuación les dejaré un enlace a un repositorio en github donde podrán encontrar la implementación de estas gráficas de una manera un poco más clara.